Grating Acuity, Pediatric Opthalmology

SKU : 3503
OSU Ohio Contrast Cards Set of 11 Cards
SKU : 3503
For the Ohio Contrast Cards contrast sensitivity test, we chose a very low spatial frequency square wave because human contrast sensitivity, when measured with square-wave gratings, is empirically high and constant over a wide range of very low spatial frequencies. 5,17–19 Therefore, the visibility of a square-wave grating does not depend very much on spatial frequency over this range (red squares and it is much closer to the peak value of the contrast sensitivity function than what is reported for sine wave stimuli (compare red squares and blue diamonds. A, which we show because those authors also used large stimuli and unlimited viewing time; see also Carney et al. 20 and Watson and Ahumada 21. The red curve. A was predicted by the standard model of contrast detection 20,21 applied to square waves of constant area, fitted to the square-wave data. A by transposing it rigidly relative to log axes to minimize the sum of squared residuals.
For the Ohio Contrast Cards contrast sensitivity test, we chose a very low spatial frequency square wave because human contrast sensitivity, when measured with square-wave gratings, is empirically high and constant over a wide range of very low spatial frequencies. 5,17–19 Therefore, the visibility of a square-wave grating does not depend very much on spatial frequency over this range (red squares and it is much closer to the peak value of the contrast sensitivity function than what is reported for sine wave stimuli (compare red squares and blue diamonds. A, which we show because those authors also used large stimuli and unlimited viewing time; see also Carney et al. 20 and Watson and Ahumada 21. The red curve. A was predicted by the standard model of contrast detection 20,21 applied to square waves of constant area, fitted to the square-wave data. A by transposing it rigidly relative to log axes to minimize the sum of squared residuals.
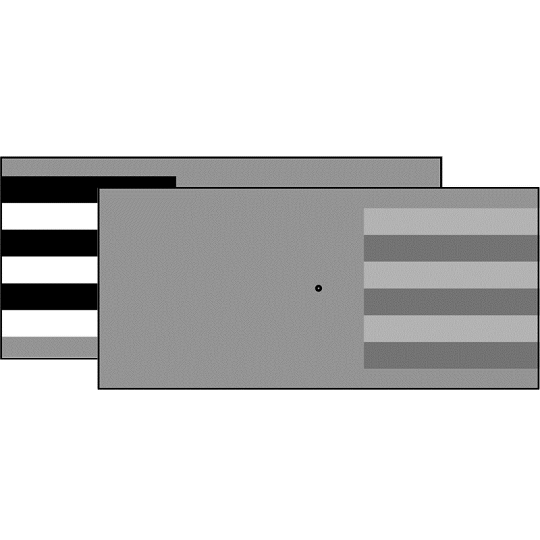
We chose a grating for the Ohio Contrast Cards rather than a single edge (red square) because it is visually distinctive, because it presents multiple edges for possible detection, and because we wanted to take advantage of the spacing of the discrete harmonics of a periodic stimulus. We chose a horizontal grating because most eye movement disorders affect horizontal more than vertical eye movements. We chose a three-cycle grating to approximate the 2.5 cycles per letter of the Sloan E, 22 while maintaining constant space-average luminance.
We placed the gratings on cards of the same dimensions (55.5 × 25.5 cm) and approximately the same overall reflectance (50%) as the Teller Acuity Cards 23 to facilitate the use of the two tests in tandem, using the same “seen/not seen” decision by the examiner. The Ohio Contrast Cards are gray, and each contains a 22 × 20-cm horizontal square-wave grating on one side of its face. The grating has a fixed spatial frequency of one cycle per 6.7 cm (at our testing distance of 57 cm, this is 0.15 cy/deg, corresponding to 20/4000 Snellen). The grating is in sine phase, with three complete cycles of light and dark bars. The near end of the grating starts 6 cm from the 3-mm peephole in the middle of the card, and the far end of the grating extended to the edge of the card. The space-average reflectance of the gratings is 50%. Contrast values for the stripes range from 96% to 1% contrast in 0.15 log10 unit steps. This progression of half-octave steps is similar to the Pelli-Robson chart.
| Brands | Precision Vision |
|---|
Related products
-
LEA Core Test, Pediatric Opthalmology
Heidi Expressions Test Game
Some children with brain damage-related vision loss may achieve near normal results in routine vision tests (large visual field and normal or near normal visual acuity), but cannot interpret facial expressions or recognize people’s faces.
SKU: 254505 -
-
Near Visual Acuity Testing, Pediatric Opthalmology
HOTV Near Vision Card
This double-sided near vision card combines proportionally-spaced lines on one and 50% spaced rectangle (Massachusetts Visual Acuity Test Format) on the other. Attached 16-inch (40 cm) measuring cord ensures proper screening distance. Includes flash cards and instructions.8 in x 10 in (20.3 cm x 25.4 cm).
16-inch, 40 cm testing distance.
SKU: 731000


