Near Vision Chart
Showing 1–24 of 26 results
-
Near Vision Chart, Ophthalmic Clinical Research
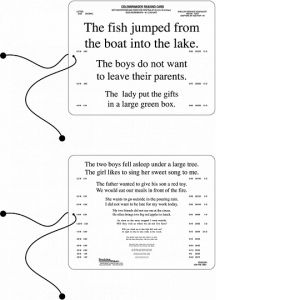
Bailey Lovie Reading Chart
Reading Chart with unrelated simple sentences or words of equal length and difficulty.
Designed by Dr. Ian Bailey (University of California, Berkeley) and Dr. Amanda H. Lueck (San Francisco State University).
Notations included: VAR at 40 cm, Points, and M Units (5.0 to 0.16)SKU: 4502 -
Near Vision Chart, Ophthalmic Clinical Research
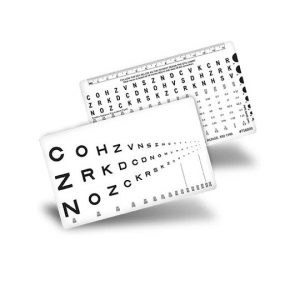
Card(Pocket) Runge – Sloan Letter Near Vision Card (16″/40cm)
 Near Vision Chart, Ophthalmic Clinical Research
Card(Pocket) Runge – Sloan Letter Near Vision Card (16″/40cm)
The Runge Near Vision Pocket Card features a format that is both easier and faster to use for near vision screening. Developed by an ophthalmologist, this Sloan Letter Near Cards mimics reading from left to right. Optotypes on the front of the card contains line sizes ranging from 20/500 to 20/16 (equivalent).
SKU: 756000 -
-
Sloan ETDRS® Format Near Vision Chart (Scrambled), Near Vision Chart
ESV1200™ and ESV1500™ – ETDRS 2000 Series – Sloan Letter – Chart 2 (16″/40cm)
 Sloan ETDRS® Format Near Vision Chart (Scrambled), Near Vision Chart
ESV1200™ and ESV1500™ – ETDRS 2000 Series – Sloan Letter – Chart 2 (16″/40cm)
ESV1200™ and ESV1500™ – ETDRS 2000 Series – Sloan Letter – Chart 2 (16″/40cm)
A Sloan Letter near vision chart for illuminated cabinets. This chart displays two tests in an ETDRS format with proportionally spaced (logMAR) lines; line sizes range from 20/400 to 20/10 (6/120 to 6/3) equivalent. This chart can either be wall mounted or used in an ESV1200™, ESV1500™, or a Model A+ illuminated cabinet.
SKU: 756300 -
-
Ophthalmic Clinical Research, Intermediate charts, Near Vision Chart
Mixed Contrast European Wide Near Vision Card 66cm
 Ophthalmic Clinical Research, Intermediate charts, Near Vision Chart
Mixed Contrast European Wide Near Vision Card 66cm
These charts are for measuring both near (33cm) and intermediate (66cm) visual acuity. Mixed contrast with high contrast on side 1 and side 2 containing 20% Weber (10% Michelson) contrast levels.
The attached cord assures accurate testing distances. Chart measures 7″ x 9″.
SKU: 2831 -
Contrast Sensitivity, Near Vision Chart, Near Vision Charts, Ophthalmic Clinical Research
Pelli Robson Chart Near Contrast Sensitivity Patti Pics
 Contrast Sensitivity, Near Vision Chart, Near Vision Charts, Ophthalmic Clinical Research
Pelli Robson Chart Near Contrast Sensitivity Patti Pics
Features Traditional Patti Pics Pediatric Optotypes Found in the Original Pelli Robson Chart! For use at 16 in (40cm) Includes three charts, each of which is scrambled.
Acuity Level 10m (20/630) at 40 cm (16 in)
SKU: 5011 -
-
-
-
Contrast Sensitivity, Near Vision Chart, Near Vision Charts, Ophthalmic Clinical Research
MNRead Chart 1 In English Black Background
 Contrast Sensitivity, Near Vision Chart, Near Vision Charts, Ophthalmic Clinical Research
MNRead Chart 1 In English Black Background
The MNREAD Acuity Charts are continuous text reading acuity charts for normal and low vision.
Often times traditional vision charts only measure general parts of normal vision, such as acuity and contrast. However, many times everyday life scenarios place these two aspects in unique situations. For example, acuity is very important in vision. Testing acuity normally involves a standard eye test. However, when reading the newspaper, the eyes are challenged by small print, continuous text, and several close contact lines. This basic living situation may cause problems for patients with scotomata and may not be detected on conventional acuity charts. Continuous text charts give one more possibility during vision testing.
SKU: C405 -
Ophthalmic Clinical Research, Near Vision Chart
Bangerter Occlusion Foil 20 20 1.0
May be used as a preventative measure for amblyopia, suppression and abnormal retinal correspondence. Used therapeutically in the treatment of amblyopia, orthoptic treatment, diplopia, diplopia with monocular aphakia (with <0.1). May be used as a primary treatment or as alternative treatment in cases where patching therapy is no longer providing further benefits.
SKU: C2020 -
Contrast Sensitivity, Near Vision Chart, Ophthalmic Clinical Research, Other charts
Balsam Alabdulkader Leat Reading Chart BAL Chart Chart 1
 Contrast Sensitivity, Near Vision Chart, Ophthalmic Clinical Research, Other charts
Balsam Alabdulkader Leat Reading Chart BAL Chart Chart 1
The BAL chart is the first, standardized continuous text near visual acuity chart in Arabic. It was designed based on the accepted design criteria for reading acuity charts
SKU: C601 -
Contrast Sensitivity, Near Vision Chart, Near Vision Charts, Ophthalmic Clinical Research
Pelli Robson Chart Near Contrast Sensitivity Sloan
 Contrast Sensitivity, Near Vision Chart, Near Vision Charts, Ophthalmic Clinical Research
Pelli Robson Chart Near Contrast Sensitivity Sloan
Features Traditional Sloan Optotypes Found in the Original Pelli Robson Chart! For use at 16 in (40cm) Includes three charts, each of which is scrambled.
Acuity Level 10m (20/630) at 40 cm (16 in)
SKU: 5013